michallkanak/symfony-message-flow-visualizer
最新稳定版本:0.1.0
Composer 安装命令:
composer require michallkanak/symfony-message-flow-visualizer
包简介
Visual tracing and debugging tool for Symfony Messenger - track message flows, visualize DAG graphs, and analyze async processing
README 文档
README
Visual tracing and debugging tool for Symfony Messenger. Track message flows, visualize DAG graphs, analyze async processing, and debug message chains.
Features
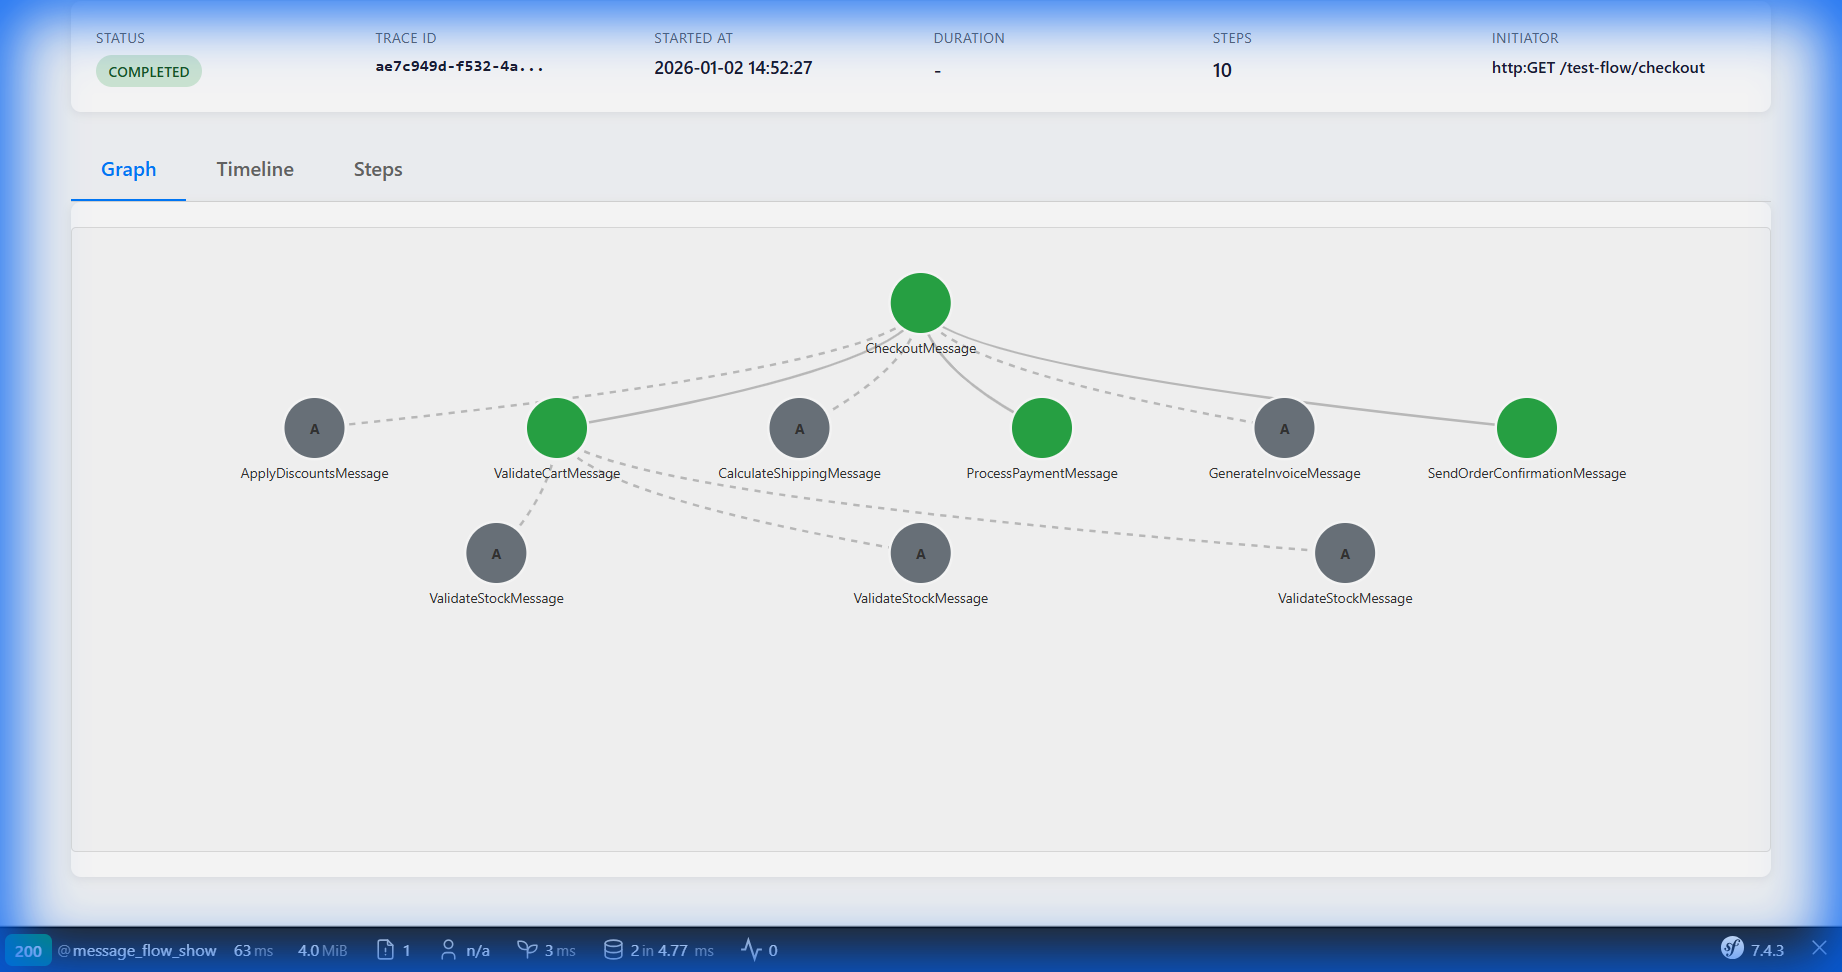
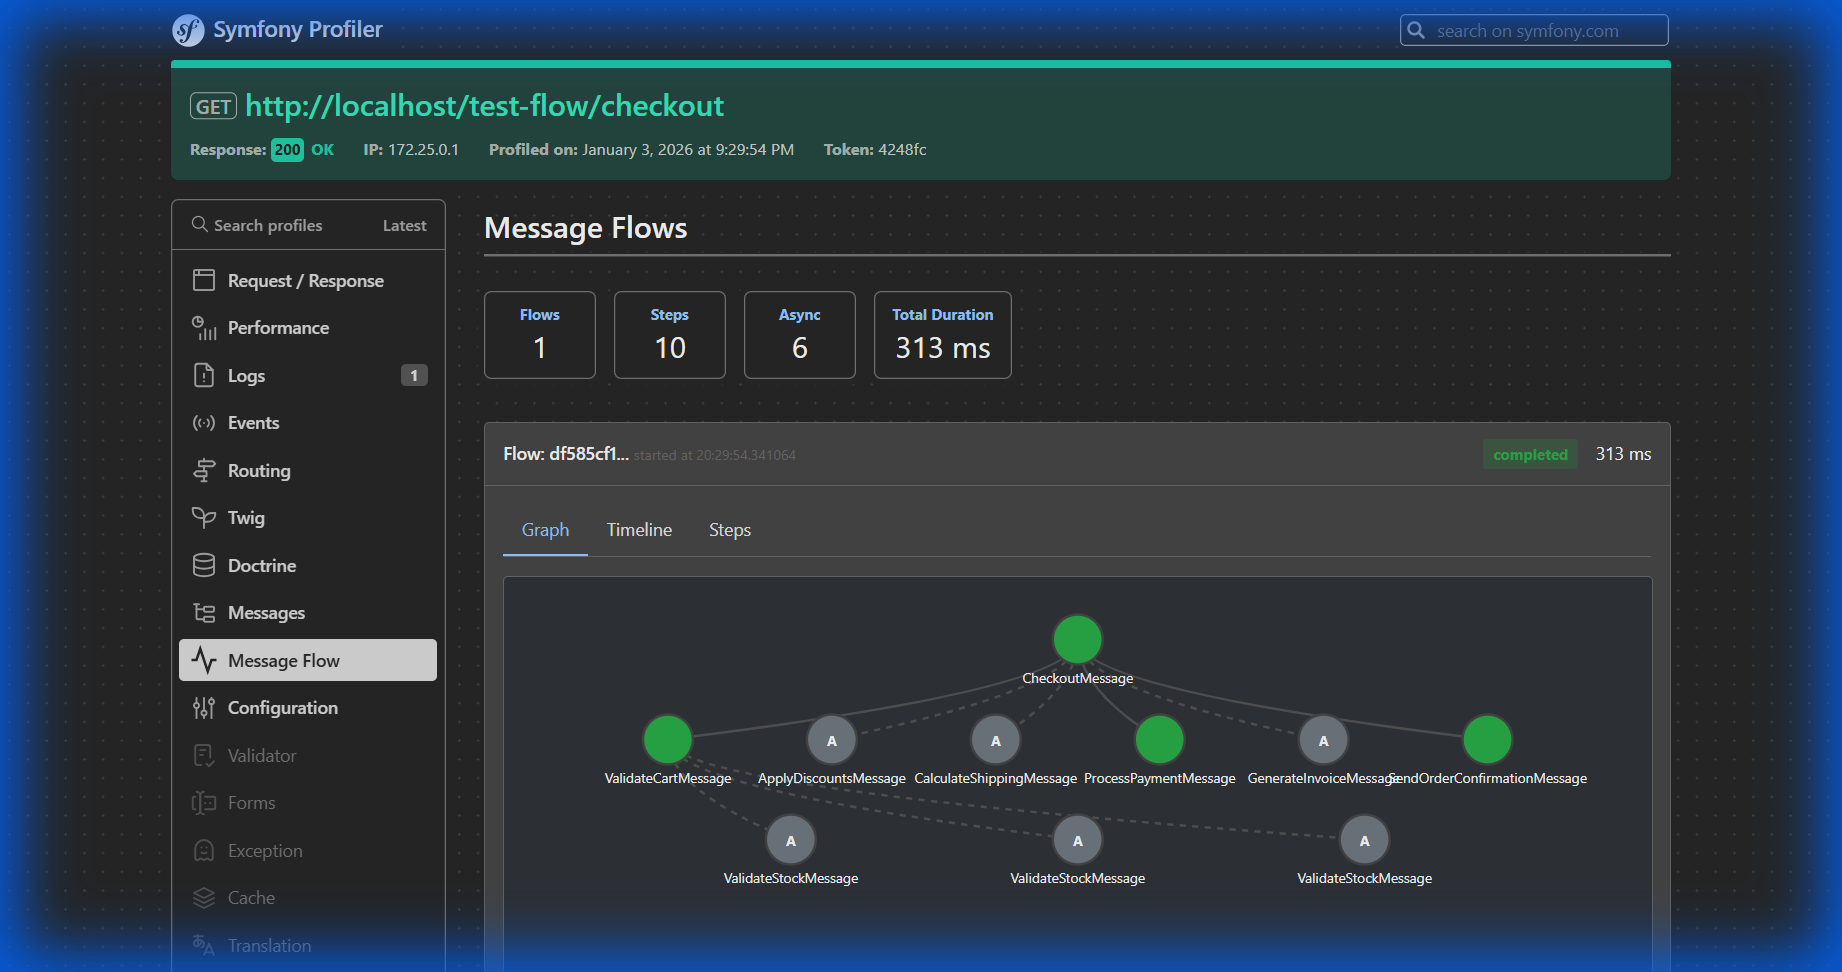
- 📊 Flow Graph Visualization - Interactive DAG diagrams showing message relationships
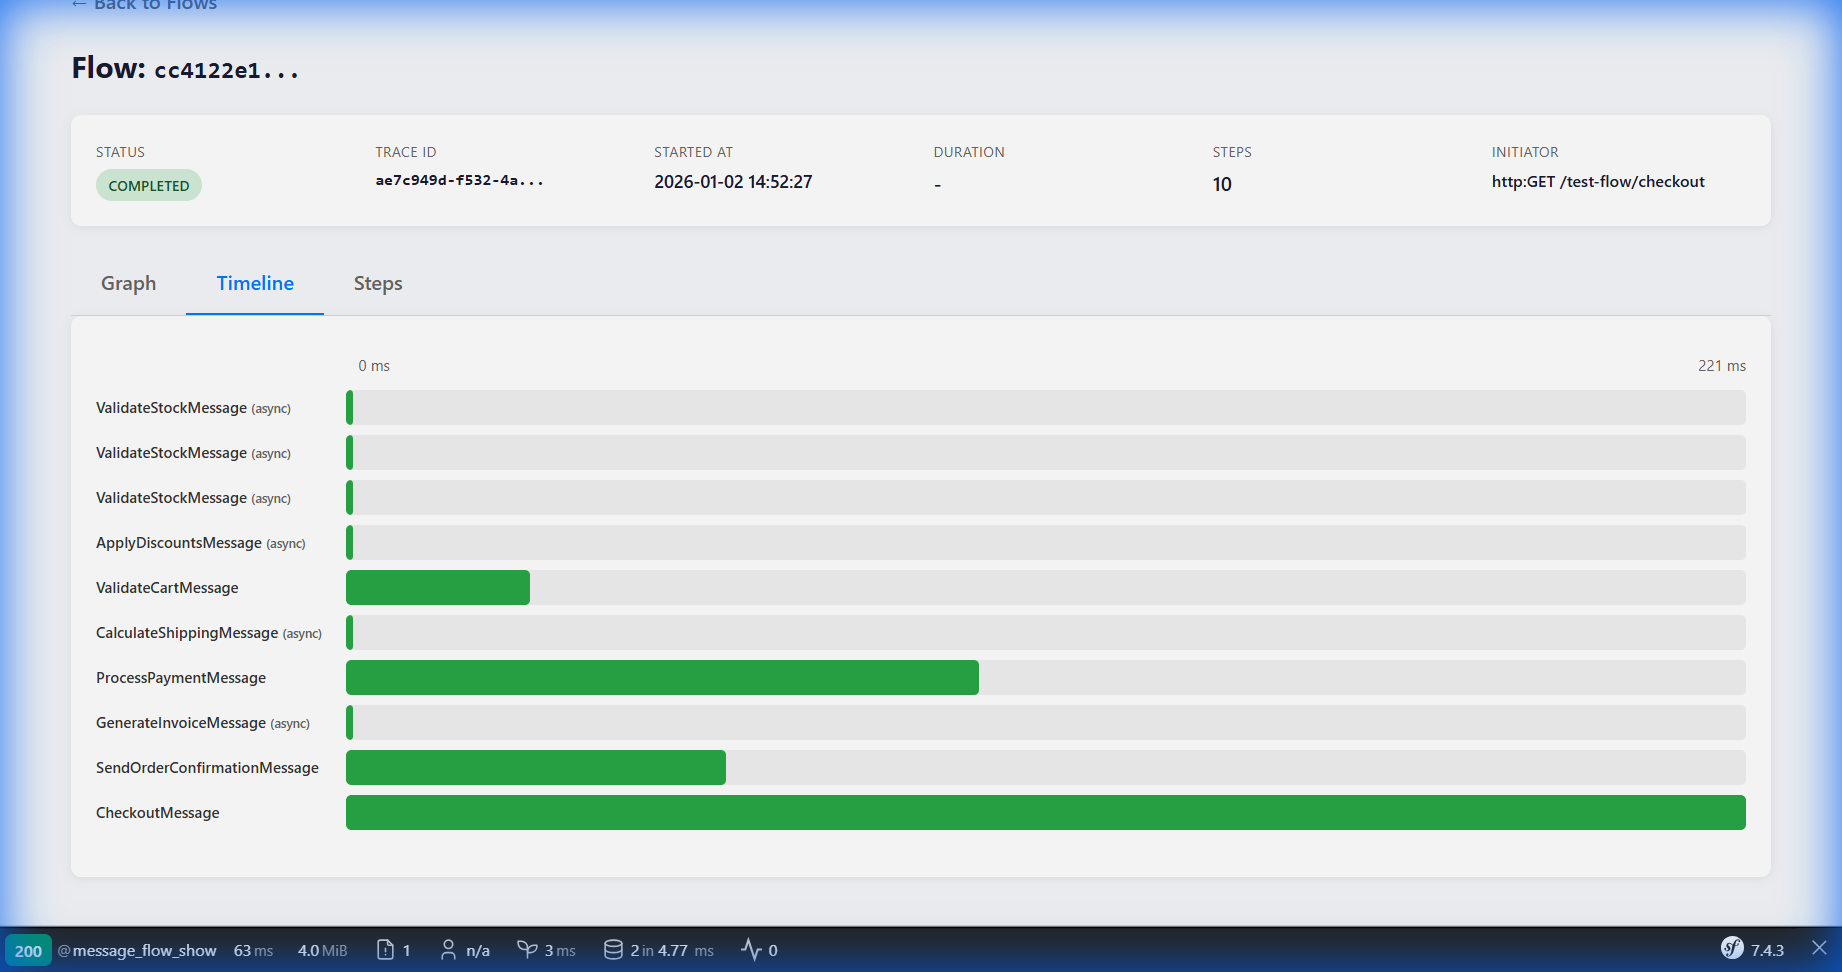
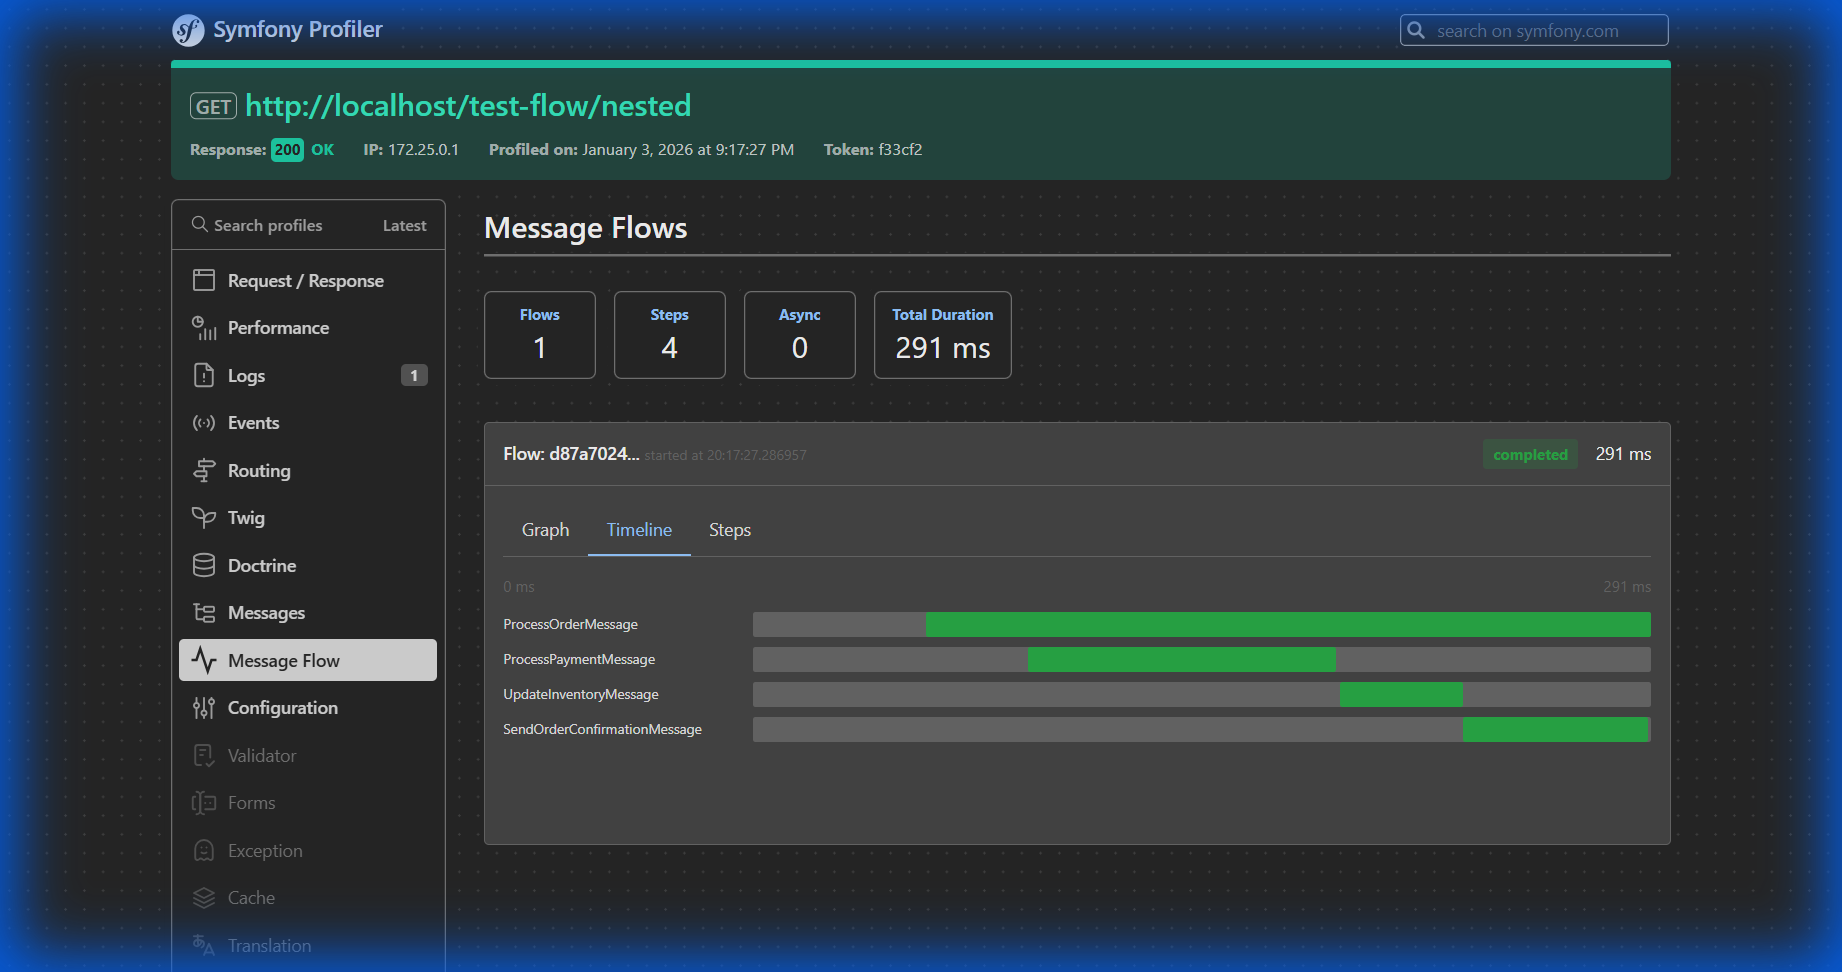
- ⏱️ Timeline View - Jaeger-style timeline with processing and queue wait times
- 🔍 Symfony Profiler Integration - Dedicated panel in the web debug toolbar
- 💻 CLI Commands - Inspect flows from the command line
- 📈 Statistics - Track message patterns and performance
- 🔗 Parent-Child Tracking - Trace message chains with correlation IDs
- ⚡ Dual Timing Metrics - Separate processing time vs queue wait time
- 🎯 Sampling Support - Production-safe with configurable sampling
Screenshots
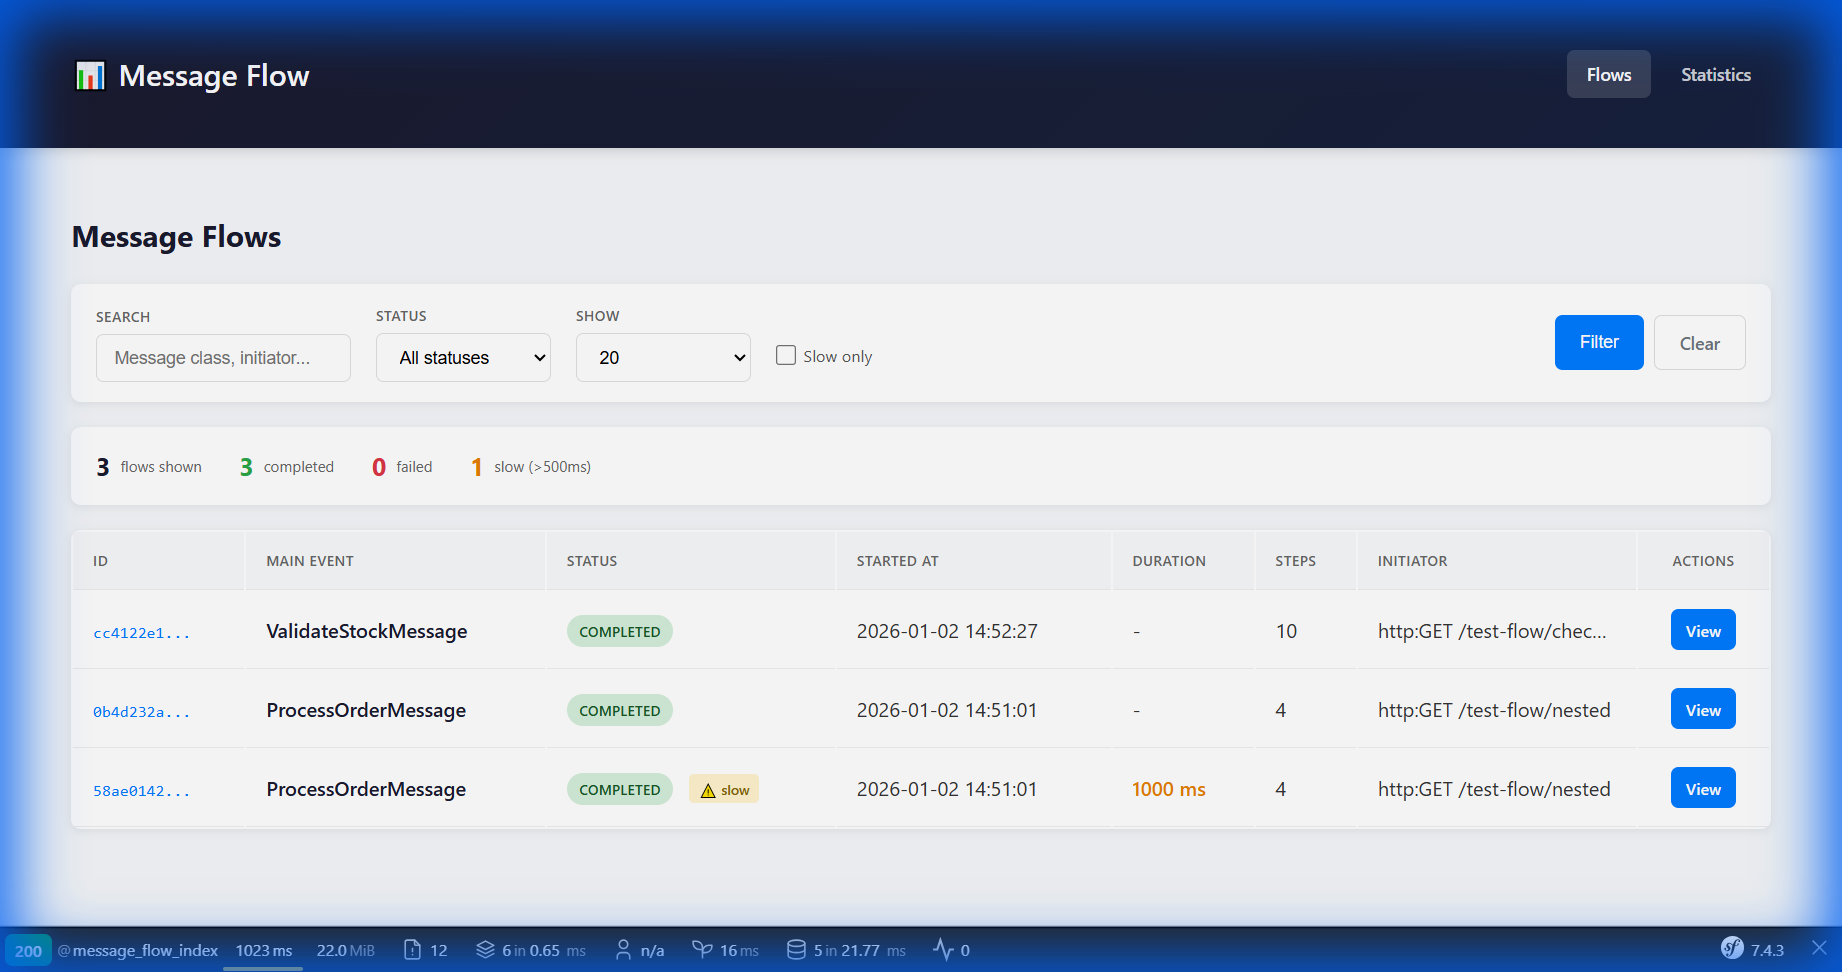
Dashboard - Flow List
Flow Graph Visualization
Timeline View
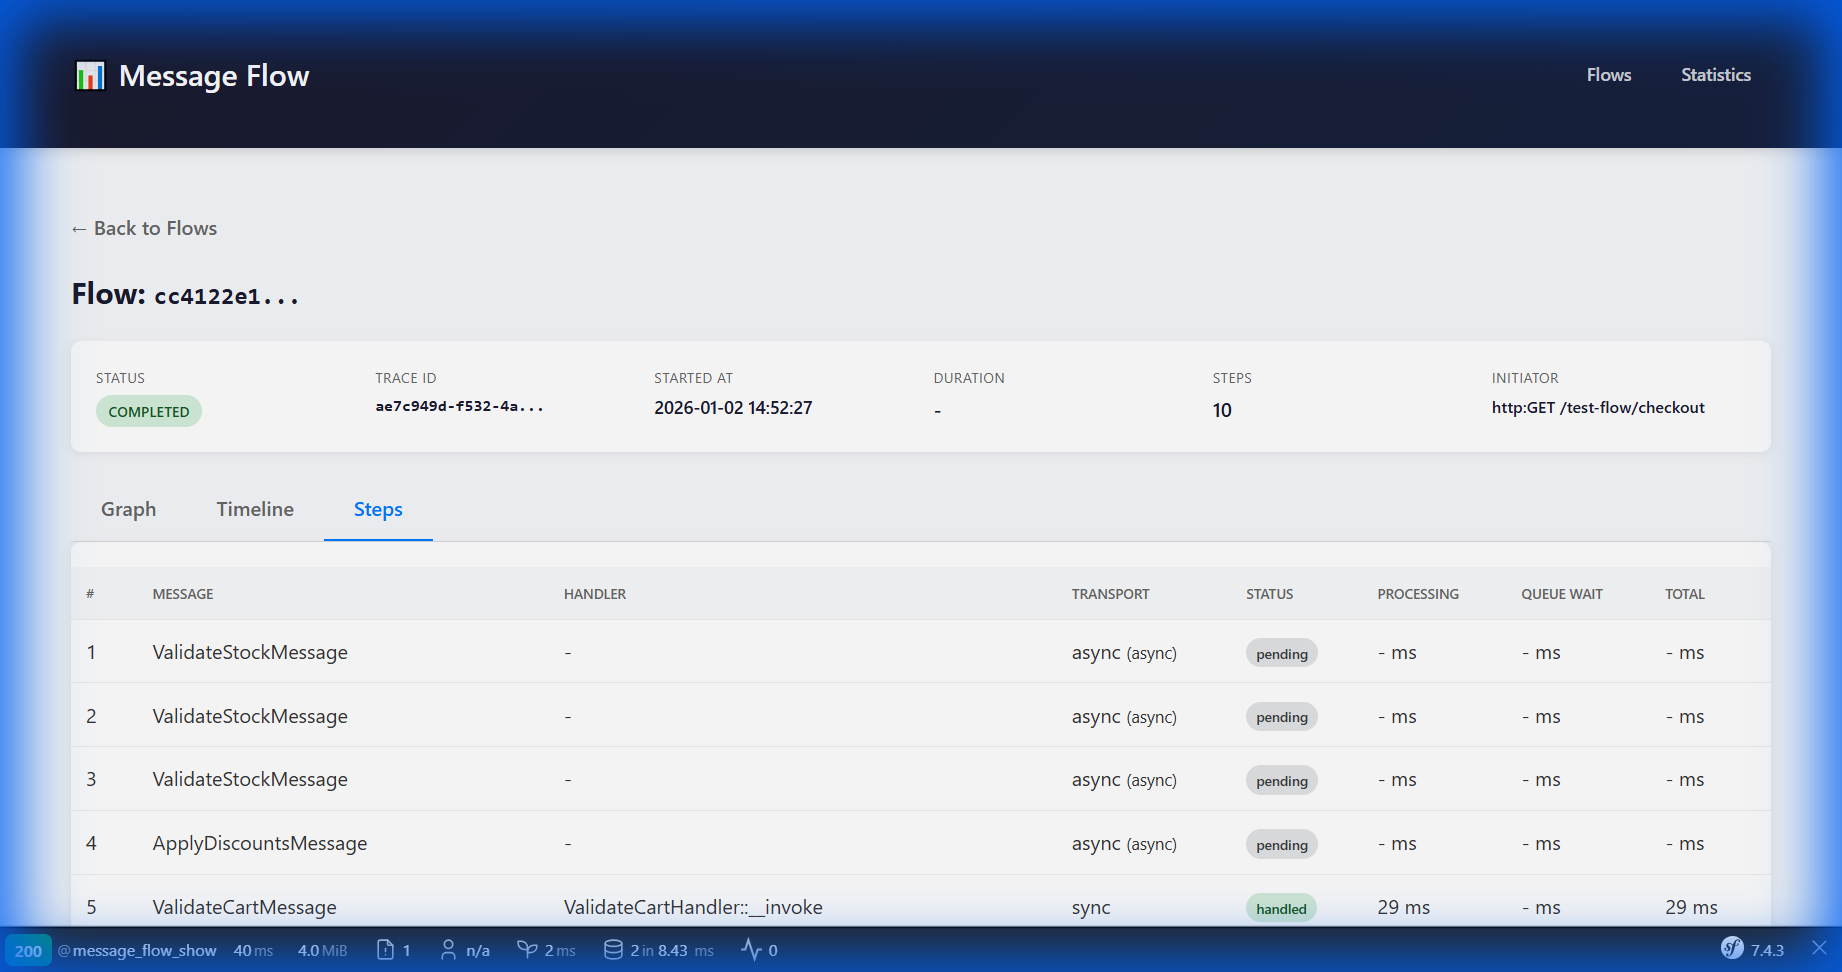
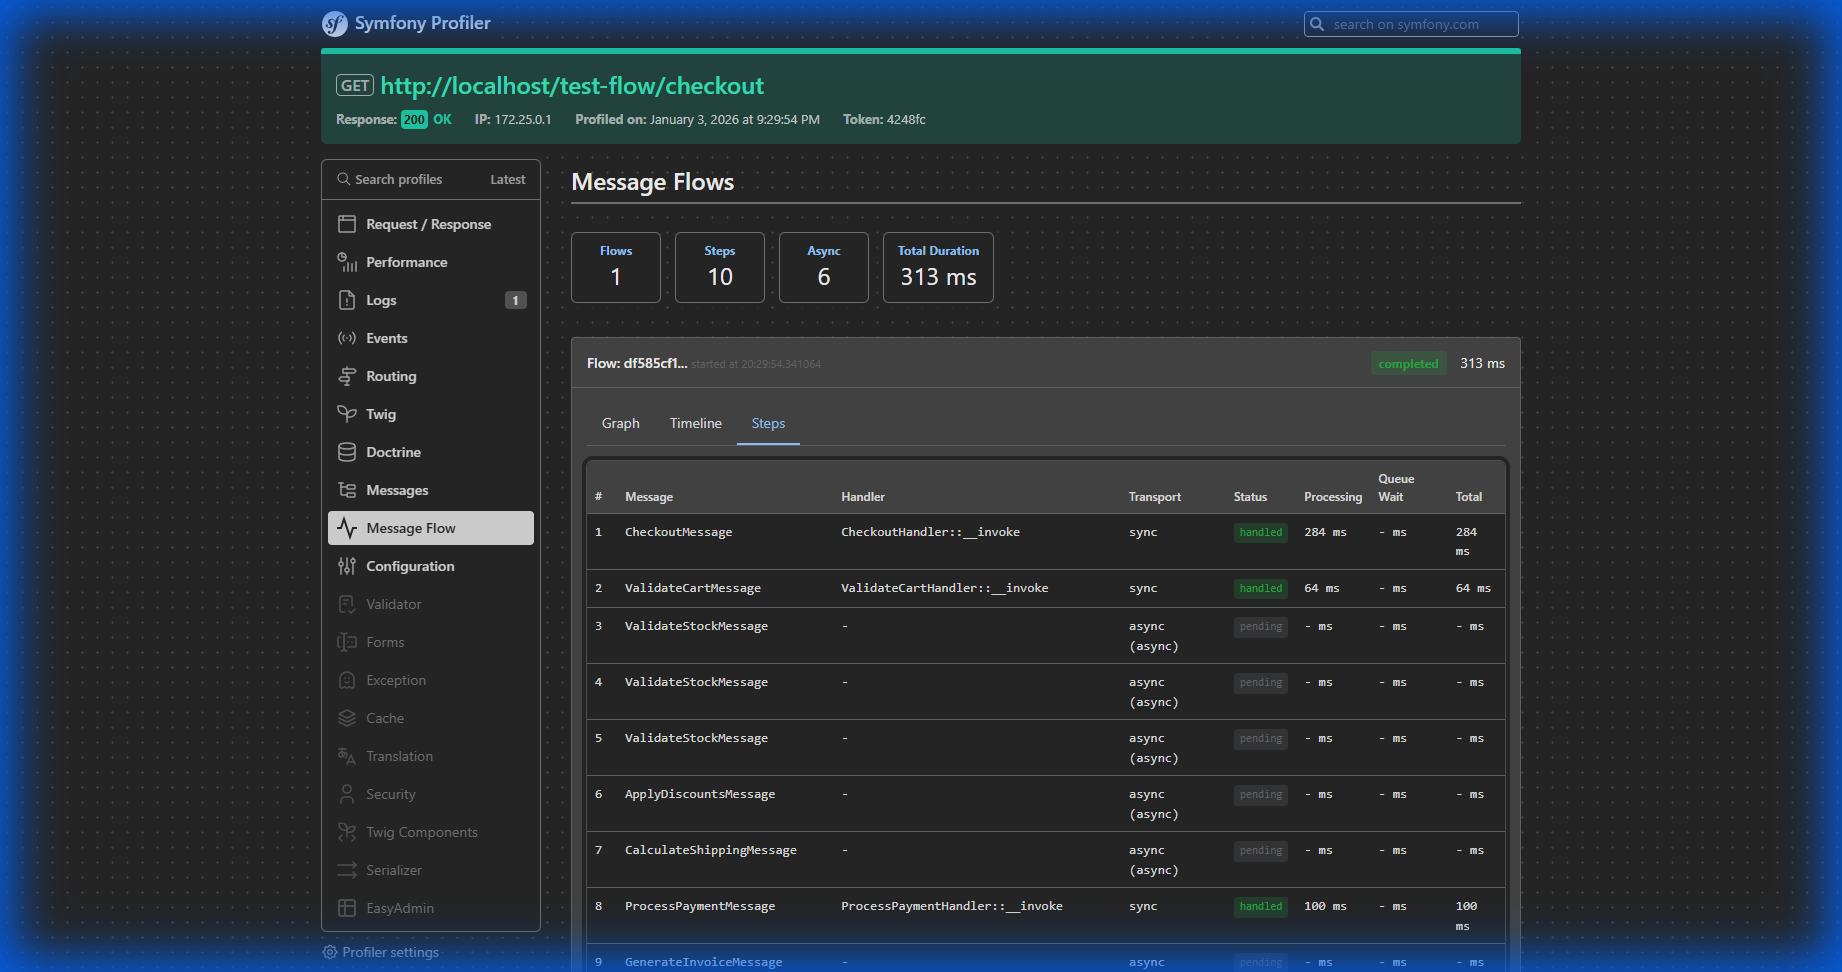
Steps Table
Symfony Profiler Integration
Profiler Timeline
Profiler Steps Table
Installation & Configuration
composer require michallkanak/symfony-message-flow-visualizer
Register the bundle:
// config/bundles.php
return [
    // ...
    MichalKanak\MessageFlowVisualizerBundle\MessageFlowVisualizerBundle::class => ['all' => true],
];
Add to your environment:
# .env
MESSAGE_FLOW_ENABLED=true
Create configuration file:
# config/packages/message_flow_visualizer.yaml
message_flow_visualizer:
    enabled: '%env(bool:MESSAGE_FLOW_ENABLED)%'
    storage:
        type: filesystem  # filesystem | doctrine | redis | memory
        path: '%kernel.project_dir%/var/message_flow'  # for filesystem
        connection: 'default'  # for redis/doctrine
    sampling:
        enabled: false    # Enable for production
        rate: 0.01        # 1% of flows when sampling enabled
    cleanup:
        retention_days: 7
    slow_threshold_ms: 500  # Mark flows >500ms as slow
Full Configuration Reference
message_flow_visualizer:
    # Enable/disable the bundle (default: env MESSAGE_FLOW_ENABLED)
    enabled: true

    # Storage backend configuration
    storage:
        # Storage type: filesystem, doctrine, redis, memory
        type: filesystem

        # Path for filesystem storage (default: %kernel.project_dir%/var/message_flow)
        path: '%kernel.project_dir%/var/message_flow'

        # Connection name for doctrine/redis (default: 'default')
        # For Redis: 'redis://localhost:6379' or 'redis://user:pass@host:6379'
        connection: 'default'

    # Sampling configuration - recommended for production
    sampling:
        # Enable to track only a percentage of flows (default: false)
        enabled: false

        # Percentage of flows to track: 0.01 = 1%, 0.1 = 10%, 1.0 = 100%
        # When a flow is sampled, ALL nested messages are tracked (sampling continuity)
        rate: 0.01

    # Data cleanup settings
    cleanup:
        # Days to keep flow data before cleanup command removes it (default: 7)
        retention_days: 7

    # Performance threshold - flows exceeding this are marked as slow (default: 500)
    slow_threshold_ms: 500
Environment-specific Examples
Development (full tracking):
# config/packages/dev/message_flow_visualizer.yaml
message_flow_visualizer:
    enabled: true
    storage:
        type: filesystem
    sampling:
        enabled: false  # Track all flows
    slow_threshold_ms: 2000  # Higher threshold for dev
Production (sampling + Doctrine):
# config/packages/prod/message_flow_visualizer.yaml
message_flow_visualizer:
    enabled: true
    storage:
        type: doctrine
    sampling:
        enabled: true
        rate: 0.01  # 1% sampling
    cleanup:
        retention_days: 30
    slow_threshold_ms: 1000
Production (sampling + Redis):
# config/packages/prod/message_flow_visualizer.yaml
message_flow_visualizer:
    enabled: true
    storage:
        type: redis
        connection: '%env(REDIS_URL)%'
    sampling:
        enabled: true
        rate: 0.05  # 5% sampling
Test (in-memory):
# config/packages/test/message_flow_visualizer.yaml
message_flow_visualizer:
    enabled: true
    storage:
        type: memory  # No persistence, fast for tests
Register the middleware:
# config/packages/messenger.yaml
framework:
    messenger:
        buses:
            messenger.bus.default:
                middleware:
                    - MichalKanak\MessageFlowVisualizerBundle\Middleware\TraceMiddleware
Usage
Symfony Profiler
The bundle automatically adds a "Message Flow" panel to the Symfony Profiler showing:
- Flow graph visualization
- Timeline view with timing breakdown
- List of all message steps with details
CLI Commands
# List recent flows
bin/console messenger:flow:list --limit=20 --status=failed

# List with pagination
bin/console messenger:flow:list --limit=10 --page=2

# Show only slow flows
bin/console messenger:flow:list --slow

# Filter by message class
bin/console messenger:flow:list --message-class=OrderMessage

# Show specific flow details
bin/console messenger:flow:show --id=abc12345

# Show flow by trace ID
bin/console messenger:flow:show --trace=xyz789

# View statistics
bin/console messenger:flow:stats --from="1 hour ago"

# Cleanup old data
bin/console messenger:flow:cleanup --older-than="7 days"

# Dry-run cleanup (preview what would be deleted)
bin/console messenger:flow:cleanup --older-than="7 days" --dry-run
Optional Dashboard
The bundle includes an optional web dashboard. To enable it, add routing:
# config/routes/message_flow.yaml
message_flow:
    resource: '@MessageFlowVisualizerBundle/src/Controller/'
    type: attribute
Then access at /message-flow/.
Storage Options
The bundle supports multiple storage backends for persisting flow data. Choose based on your needs:
| Storage | Best For | Persistence | Setup Effort |
|---|---|---|---|
| Filesystem | Development, simple deployments | File-based | None |
| Redis | High-performance, distributed systems | In-memory with TTL | Low |
| Doctrine | Production, long-term analytics | Database | Medium |
| InMemory | Testing only | None (request-scoped) | None |
Filesystem (Default)
Zero configuration required. Stores JSON files in your project directory.
# config/packages/message_flow_visualizer.yaml
message_flow_visualizer:
    enabled: true
    storage:
        type: filesystem
        path: '%kernel.project_dir%/var/message_flow'
Setup: None required. Directory is created automatically.
Cleanup:
bin/console messenger:flow:cleanup --older-than="7 days"
Redis
Fast, ephemeral storage with automatic TTL-based cleanup. Requires predis/predis.
1. Install Predis:
composer require predis/predis
2. Configure bundle:
# config/packages/message_flow_visualizer.yaml
message_flow_visualizer:
    enabled: true
    storage:
        type: redis
        connection: 'redis://localhost:6379'
        # Or with password: 'redis://user:password@localhost:6379'
3. Configure Predis service (optional, for custom options):
# config/services.yaml
services:
    Predis\Client:
        arguments:
            - '%env(REDIS_URL)%'
Note: Data expires automatically based on TTL (default: 7 days).
Doctrine
Persistent database storage with full query capabilities. Uses your existing Doctrine connection.
1. Configure bundle:
# config/packages/message_flow_visualizer.yaml
message_flow_visualizer:
    enabled: true
    storage:
        type: doctrine
2. Generate and run migrations:
# Generate migration for bundle tables
bin/console doctrine:migrations:diff

# Run migrations
bin/console doctrine:migrations:migrate
This creates two tables:
mfv_flow_run- Flow runs with indexes ontrace_id,started_at,statusmfv_flow_step- Steps with foreign key to flow runs
Cleanup:
bin/console messenger:flow:cleanup --older-than="30 days"
InMemory (Testing Only)
⚠️ WARNING: Not suitable for production with async messages!
Data is stored only in PHP process memory and lost when process ends. Since Messenger workers run in separate processes, async message statuses will NOT be updated.
# config/packages/message_flow_visualizer.yaml (test environment only)
message_flow_visualizer:
    enabled: true
    storage:
        type: memory
Use cases:
- Unit and integration tests
- Development with synchronous transport only
Timing Metrics
Each message step tracks:
- Processing Duration - Time spent in the handler
- Queue Wait Duration - Time waiting in async queue
- Total Duration - Sum of both
[dispatch] ----[queue wait]---- [processing] [complete]
            ↑                   ↑
            queueWaitDurationMs processingDurationMs
            ←───────── totalDurationMs ──────────→
Sampling for Production
Enable sampling to reduce overhead in production:
message_flow_visualizer:
    sampling:
        enabled: true
        rate: 0.01  # Track 1% of flows
Important: When a flow is sampled, ALL related messages are tracked (sampling continuity). No fragmented traces.
Data Model
FlowRun
Represents a complete message flow:
| Field | Description |
|---|---|
| id | Unique identifier |
| traceId | Correlation ID for distributed tracing |
| status | running / completed / failed |
| startedAt | Flow start timestamp |
| finishedAt | Flow end timestamp |
| initiator | What triggered the flow (HTTP request, CLI, etc.) |
FlowStep
Represents a single message dispatch/handling:
| Field | Description |
|---|---|
| messageClass | FQCN of the message |
| handlerClass | FQCN of the handler |
| transport | sync / doctrine / redis / rabbitmq |
| isAsync | Whether processed asynchronously |
| status | pending / handled / failed / retried |
| processingDurationMs | Handler execution time |
| queueWaitDurationMs | Time in queue (async only) |
| totalDurationMs | Total time from dispatch to complete |
Technologies Used
Graph Visualization
The bundle uses native SVG with JavaScript for rendering interactive DAG (Directed Acyclic Graph) visualizations:
- SVG-based rendering - Lightweight, no external dependencies required
- Hierarchical layout - Automatic tree-like positioning for message flows
- Interactive tooltips - Hover over nodes to see message details, handler info, and timing metrics
- Async indicators - Visual distinction between sync and async message processing
- Responsive design - Graphs automatically adjust to container size
The graph visualization is implemented in vanilla JavaScript to minimize bundle dependencies and ensure maximum compatibility with Symfony projects.
Requirements
- PHP 8.2+
- Symfony 6.4 or 7.x
- Symfony Messenger component
License
MIT License. See LICENSE for details.
Contributing
Contributions are welcome! Please read the contributing guidelines before submitting PRs.
Credits
Created by Michał Kanak
统计信息
- 总下载量: 0
- 月度下载量: 0
- 日度下载量: 0
- 收藏数: 0
- 点击次数: 0
- 依赖项目数: 0
- 推荐数: 0
其他信息
- 授权协议: MIT
- 更新时间: 2026-01-05
