pixers/doctrine-profiler-bundle
最新稳定版本:v1.0.8
Composer 安装命令:
composer require pixers/doctrine-profiler-bundle
包简介
PIXERS Doctrine profiler bundle
README 文档
README
PixersDoctrineProfilerBundle enables new panel in Symfony debug toolbar that allows you to profile performance of your database queries.
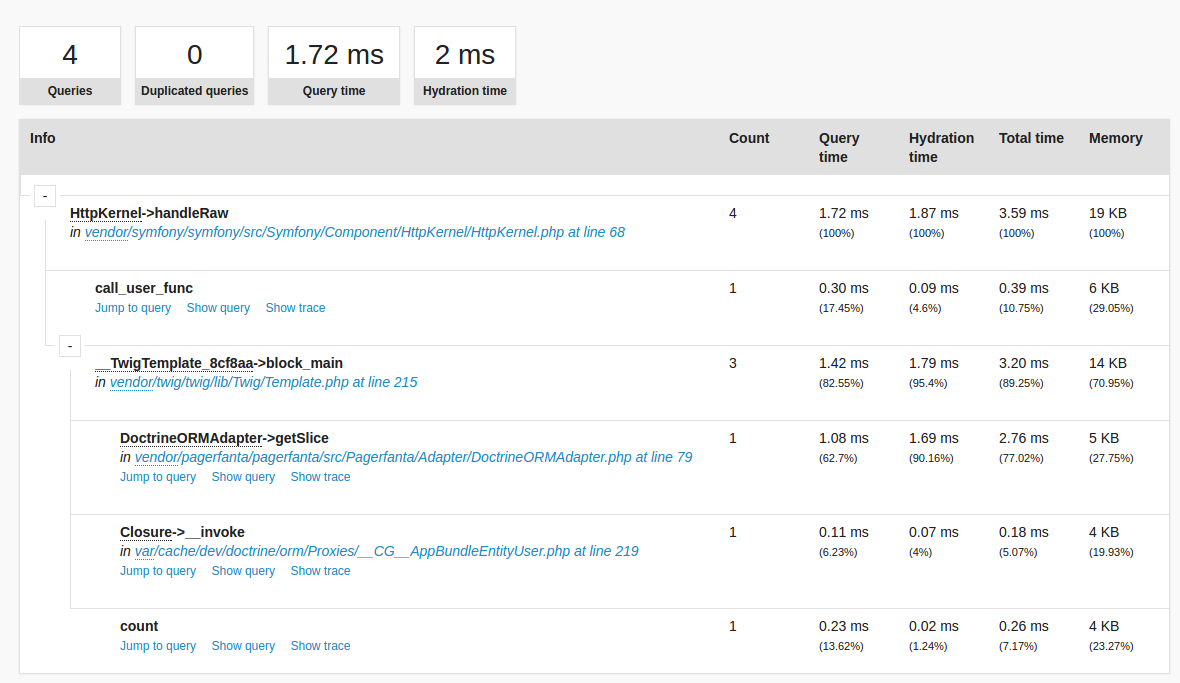
It provides extensive information about Doctrine queries execution time and memory. It also allows you to spot inefficient places of your application by showing hot spots in a call graph.
Features:
-
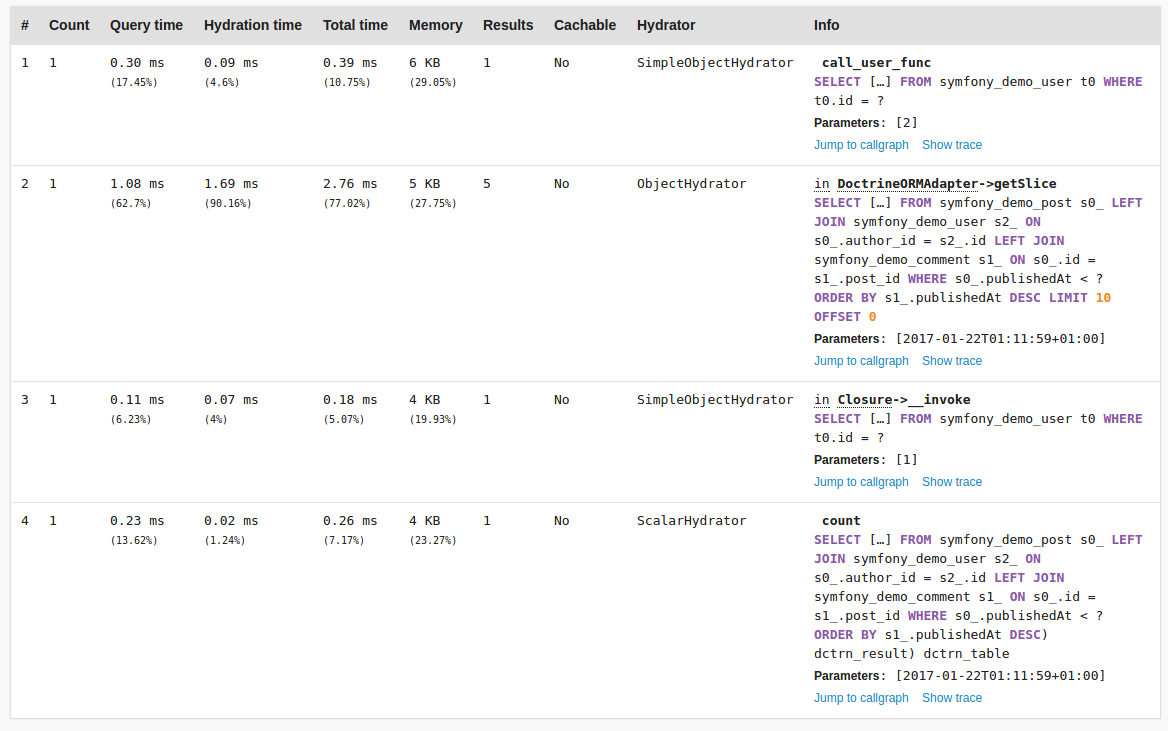
Detailed query profile
- Memory usage
- Cache info
- Duplicated queries detection
-
Hydration profiling
- Type and time of hydration
- Visualization in performance panel (execution timeline)
-
Query origin
- Call graph with metrics aggregated across code
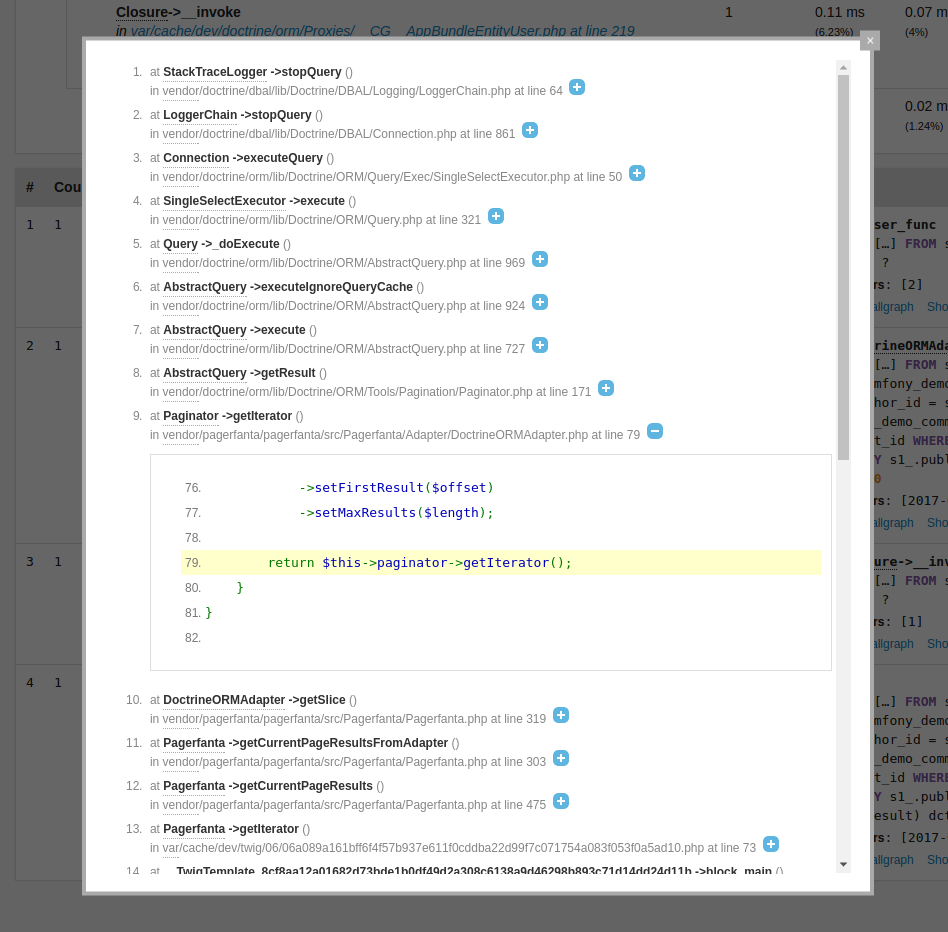
- Stacktrace of the queries
Installation
Installation is a two step process.
-
Install this bundle using Composer:
$ composer require pixers/doctrine-profiler-bundle
-
Enable bundle in AppKernel (only in dev and test environments):
// in AppKernel::registerBundles()

if (in_array($this->getEnvironment(), array('dev', 'test'))) {
    // ...
    $bundles[] = new Pixers\DoctrineProfilerBundle\PixersDoctrineProfilerBundle();
}
Screens
Toolbar:
Call graph:
Queries:
Stacktrace:
About
DoctrineProfilerBundle is an initiative of PIXERS:
- Bartłomiej Ojrzeński bartlomiej.ojrzenski@pixers.pl
- Antoni Orfin antoni@scalebeat.com
License
Copyright 2017 PIXERS Ltd - www.pixersize.com
Licensed under the BSD 3-Clause
统计信息
- 总下载量: 157.11k
- 月度下载量: 0
- 日度下载量: 0
- 收藏数: 49
- 点击次数: 0
- 依赖项目数: 0
- 推荐数: 0
其他信息
- 授权协议: BSD-3-Clause
- 更新时间: 2017-01-25


