zazza/phalcon2-debug-widget
Composer 安装命令:
composer require zazza/phalcon2-debug-widget
包简介
Phalcon debug toolbar for Phalcon 2
README 文档
README
-
Forked from jymboche/phalcon-debug-widget
-
Update from https://github.com/Zazza/phalcon-debug-widget
Changelog:
2 February 2018:
- db panel output with htmlspecialchars
=====
1 February 2018:
- The 'server' tab has been removed. Since this data can be viewed to any firebug from the browser
- By default, css, js and html PDW code is minimized:
$ debugWidget = new \ PDW \ DebugWidget ($ di);
or
$ debugWidget = new \ PDW \ DebugWidget ($ di, [
         'db' => ['db'],
         'dispatch' => ['dispatcher'],
         'view' => ['view']
     ], $ minimify = false);
=====
- it isn't necessary to move assets(/pdw-assets/) to public dir
- jquery dependence is removed
- the sections: Server, Views, Database hide and show by click
Note (How it works):
The debug widget for now is very simplistic and more of a proof-of-concept. It expects you have three services in your dependency injector named "db", "dispatcher" and "view" and that they correspond to those services. When you pass the DI to Phalcon Debug Widget It looks for those specific services and:
- sets them as shared services
- sets the eventManager for them
- Attaches itself to those events
This means passing the DI to the debug widget will alter those services. Generally speaking, a shared db, dispatcher, and view is fine. If you have ideas for other ways to hook in, please open an issue for discussion.
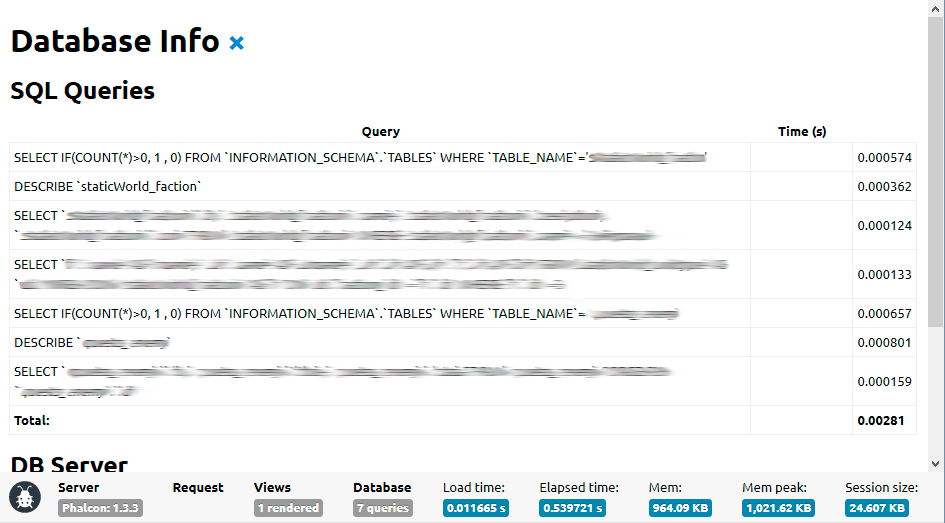
The Phalcon Debug Widget is designed to make development easier by displaying debugging information directly in your browser window. Currently it displays php globals such as $_SESSION as well as outputing resource usage and database queries and connection information. It includes syntax highlighting via Prismjs.com.
If it looks familiar, its because its modeled after the Yii debug toolbar
Installation
composer.json:
"zazza/phalcon2-debug-widget": "dev-master"
Copy or move the /vendor/zazza/phalcon-debug-widget/src/pdw-assets folder to your public folder.
Usage and Configuration
Define a debug or environment flag in your main index.php file so you can easily disable the Phalcon Debug Widget on production environments. Example:
defined('PHALCONDEBUG') || define('PHALCONDEBUG', true);
After you have setup your \Phalcon\Loader and \Phalcon\DI\FactoryDefault() create a new instance of the debug widget.
if (PHALCONDEBUG == true) {
	$debugWidget = new \PDW\DebugWidget($di);
}
Preview
Attribution:
Bug Icon designed by Nithin Viswanathan from the Noun Project
统计信息
- 总下载量: 3.01k
- 月度下载量: 0
- 日度下载量: 0
- 收藏数: 1
- 点击次数: 1
- 依赖项目数: 0
- 推荐数: 0
其他信息
- 授权协议: MIT
- 更新时间: 2015-04-23
